Are Inverted Yield Curves Signaling A Recession Or A Deflationary Boom? - 10 minutes read
 Are Inverted Yield Curves Signaling A Recession Or A Deflationary Boom?
Given the context of the past 100 years, economists generally do not believe that "this time is different," or that an inverted yield curve actually is good news.
Now that yield curves are inverting, investors seem to be bracing for bad news. In the last 100 years, inverted yield curves have foreshadowed recessions within roughly a year, as indicated by the below data points.
For the first time in 100 years, we believe that innovation is picking up at a pace not seen since the turn of the nineteenth century, causing a confluence of abnormal economic signals that are stirring fear, uncertainty, and doubt. In our view, however, these signals could be harbingers of boom times ahead. The inverted yield curve appears to be causing more fear than any other economic statistic. That said, accelerating real growth in the US in the face of slower than expected growth in the rest of the world and lower-than-expected inflation and interest rates globally also are causing serious doubts about the sustainability of this expansion. Corporate tax reform and deregulation have played important roles, boosting growth and returns on invested capital in the US relative to those in the rest of the world, bolstering the dollar and, importantly, stimulating innovation. While conflicts with many of our major trading partners seem to be distorting the picture now, if our understanding of this Administration's priorities is correct, the resolution will involve lower tariffs - in effect lower tax rates - globally, potentially paving the way for waves of innovation to gather momentum and sweep across the world.
While many equity and fixed income investors have been puzzled by the flattening yield curve, especially in the face of stronger-than-expected economic activity, we have gained confidence that the five innovation platforms upon which ARK Invest focuses its research are gaining traction and wreaking havoc with traditional economic and financial metrics. The five innovation platforms are DNA sequencing, robotics, energy storage, artificial intelligence, and blockchain technology. Technologically enabled, each platform is characterized by declining cost curves, surges in productivity, and rapid real growth. Not since the late nineteenth century have multiple innovation platforms evolved at the same time.
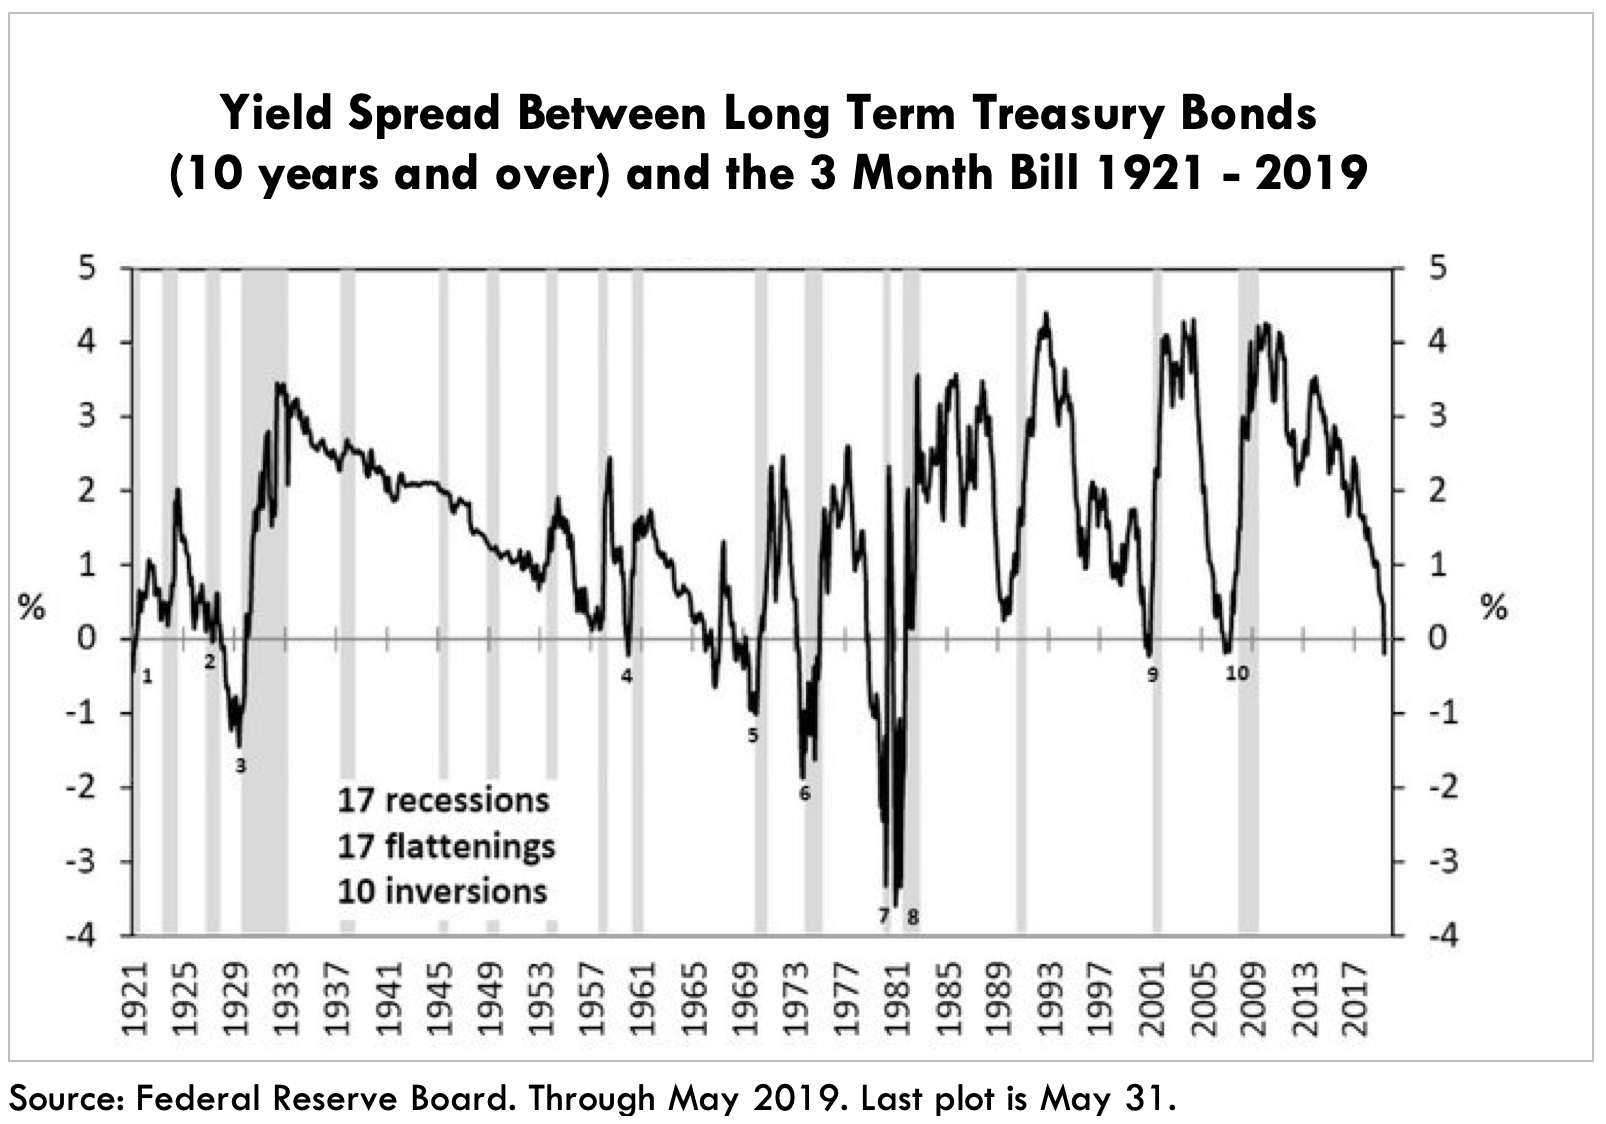
Roughly 150 years ago, the three innovation platforms that changed the way the world worked were the internal combustion engine, telephone, and electricity. During the 50 years ended 1929, unit growth and productivity surprised on the high side of expectations as inflation surprised on the low side, creating a "deflationary boom" and an inverted yield curve, as shown below. In fact, unlike the case in the last 100 years, positively sloped yield curves were rare and, in the absence of the Federal Reserve until 1913, the economy was much more susceptible to downturns than it is today, as depicted by the shaded areas below. As detailed in an analysis of that time period by the National Bureau of Economic Research (NBER), short rates rose in response to rapid real growth, while long rates lagged in response to lower inflation, creating a virtuous cycle that stimulated equity markets.
Innovation platforms today are evolving at a rate faster than those in the late 1800s. Perhaps contributing to some confusion in understanding their impact today, the government still reports statistics that evolved during the industrial age as gauges of economic momentum in the digital age. As a result, they probably are understating real growth and productivity, and overstating inflation. Combined with tax reform and deregulation in the US and China, the five platforms could unleash tsunamis of innovation that will change the way the world works, creating a deflationary boom rivaling that which led to the Roaring Twenties early in the twentieth century. In that environment, an inversion of the yield curve would be exceedingly good news for the equity markets.
If the Fed were to interpret the inverted yield curve as a call to cut short-term rates, it could turbocharge the deflationary boom. The chart below is suggesting such a possibility.
This chart suggests that Fed policy is not tight. Before or during past crises, the Fed has ignored signals from the three-month Treasury Bill Rate and tightened too much or eased too late and too little, allowing the three-month Treasury Bill Rate to drop more than 20 basis points (bps) below the Fed Funds Rate. Today, the Fed seems to be following the economy in setting policy, not trying to get ahead of it or to cut it off. Indeed, the Treasury Bill Rate was nearly 20 basis points above the Fed Funds Rate, higher than it had been in nearly 25 crisis-prone years, until recently and could head back up if the Fed cuts the Fed Funds Rate this month. In other words, the Fed is more likely to turbocharge than to derail the innovation boom that we see brewing.
Given the context of the past 100 years, economists generally do not believe that "this time is different," or that an inverted yield curve actually is good news. Yet, in the context of disruptive innovation, this time is not different. During the 50 years ended 1929, the yield curve was inverted nearly two-thirds of the time. The dawn of electricity, telephony, and the internal combustion engine stimulated real growth and productivity, the latter of which kept a lid on inflation. Through many booms and busts in an era of creative destruction without the Federal Reserve and with minimal government intervention, US real GDP growth averaged 3.7% and inflation 1.1%, while short rates averaged roughly 4.8% and long rates roughly 3.8%. The yield curve was inverted.
So, this time is not different, but investors do have to delve deeply into history to understand the impact of profound technological breakthroughs on economic activity, yield curves, and wealth creation. ARK aims to surface and capitalize on innovation platforms that will have to harness the public equity markets to scale exponentially during the next five to twenty years.
1. This chart is based on the data through July 8, 2019.
2. John H Wood, Federal Reserve Bank of Chicago, "Do yield curves normally slope up? The term structure of interest rates, 1862-1892".
3. ARK Investment Management LLC, 2018; Data sourced from: Bloomberg,http://socialdemocracy21stcentury.blogspot.com/2012/09/us-real-per-capita-gdp-from-18702001.htmlandhttps://www.armstrongeconomics.com/us-population-1776-date/in combination were used to calculate the Real GDP Number;http://www.in2013dollars.com/inflation-rate-in-1929;http://www.multpl.com/10-year-treasury-rate/table/by-year.
Disclosure: ARK's statements are not an endorsement of any company or a recommendation to buy, sell or hold any security. For a list of all purchases and sales made by ARK for client accounts during the past year that could be considered by the SEC as recommendations,click here. It should not be assumed that recommendations made in the future will be profitable or will equal the performance of the securities in this list. For full disclosures,click here.
Disclaimer: ©2019, ARK Investment Management LLC ("ARK"). All content is original and has been researched and produced by ARK unless otherwise stated. No part of ARK's original content may be reproduced in any form, or referred to in any other publication, without the express written permission of ARK. The content is available for informational purposes only and is subject to change without notice. All statements made regarding companies or securities or other financial information on this site or any sites relating to ARK are strictly beliefs and points of view held by ARK or the third party making such statement and are not endorsements by ARK of any company or security or recommendations by ARK to buy, sell or hold any security. For a list of all purchases and sales made by ARK for client accounts during the past year that could be considered by the SEC as recommendations,click here. It should not be assumed that recommendations made in the future will be profitable or will equal the performance of the securities in this list. For full disclosures, please see the Terms of Use for this site.
Editor's Note: The summary bullets for this article were chosen by Seeking Alpha editors.
Source: Seekingalpha.com
Powered by NewsAPI.org
Keywords:
Recession • Deflation • Business cycle • Century • Economics • Time • Yield curve • Yield curve • Innovation • Fear, uncertainty and doubt • Business cycle • Yield curve • Economics • Statistics • Real versus nominal value (economics) • Economic growth • Economic growth • Expected utility hypothesis • Inflation • Interest rate • Sustainability • Economic growth • Tax reform • Deregulation • Economic growth • Innovation • International trade • Public administration • Tariff • Momentum (finance) • Stock • Fixed income • Investor • Yield curve • Expected utility hypothesis • Economics • Innovation • Scientific method • DNA sequencing • Robotics • Energy storage • Artificial intelligence • Blockchain • Technology • Cost curve • Productivity • Economic growth • Innovation • Evolution • Time • Innovation • World • Internal combustion engine • Telephone • Electricity • Economic growth • Productivity • Rational expectations • Inflation • Deflation • Business cycle • Yield curve • Federal Reserve System • National Bureau of Economic Research • National Bureau of Economic Research • Real versus nominal value (economics) • Economic growth • Inflation • Virtuous circle and vicious circle • Stock market • Innovation • Government • Statistics • Industrial Revolution • Economics • Information Age • Real versus nominal value (economics) • Economic growth • Productivity • Inflation • Tax reform • Deregulation • China • Innovation • Public works • Deflation • Business cycle • Roaring Twenties • Environmental policy • Stock market • Federal Reserve System • Yield curve • Call option • Deflation • Business cycle • Federal Reserve System • Public policy • Federal Reserve System • United States Treasury security • Interest rate • United States Treasury security • Basis point • Basis point • Federal funds rate • Economy • Economic policy • United States Treasury security • Basis point • Federal funds rate • Federal funds rate • Innovation • Business cycle • Contextualism • Past • Century • Economics • Time • Yield curve • Disruptive innovation • Time • Stress–strain curve • Time • Electricity • Telephone • Internal combustion engine • Real versus nominal value (economics) • Economic growth • Productivity • Inflation • Business cycle • Creative destruction • Federal Reserve System • Minarchism • Economic interventionism • Gross domestic product • Inflation • Short (finance) • Yield curve • Time • Investment • History • Technology • Economics • Yield curve • Wealth • Creation myth • Innovation • Stock market • Federal Reserve Bank of Chicago • Yield curve • Yield curve • Investment management • Limited liability company • Bloomberg L.P. • Gross domestic product • Corporation • Company • Sales • Customer • Financial statement • U.S. Securities and Exchange Commission • Profit (accounting) • Performance management • Security (finance) • Investment management • Limited liability company • Information • Belief • Sales • Customer • Financial statement • U.S. Securities and Exchange Commission • Security (finance) • Terms of service • Seeking Alpha •