Fed "Hopes" Spark Return Of Bullish Complacency - 6 minutes read
 Fed "Hopes" Spark Return Of Bullish Complacency
In this past weekend’s newsletter, I laid out the bull and bear case for the S&P 500 rising to 3300. In summary, the basic driver of the “bull market thesis” essentially boils down to Central Bank policy, as noted by the WSJ yesterday:
In other words, it is all about “rate cuts.”
This reliance on the Fed has led to a marked rise in “complacency” by investors in recent weeks despite a burgeoning list of issues. As shown in the chart below, the ratio of the “volatility index” as compared to the S&P 500 index is near it’s lowest level on record going back to 1995.
(Of course, exceedingly low levels of volatility relative to the S&P 500 have historically denoted periods of price corrections or worse.)
The following considerations fly in the face of the high level of complacency ruling the financial markets:
There is much more, but you get the idea.
As we previously wrote for our RIA PRO Subscribers: (Get A 30-day FREE Trial)
What both charts above show is that when these complacency has previously reached such low levels, a surge occurred soon thereafter. This does not mean the index will bounce higher immediately, but it does suggest we should expect higher volatility over the next few months.
Furthermore, prices are ultimately constrained by longer-term moving averages. At the beginning of May, I wrote “A Warning About Chasing This Bull Market,” and in particular noted the deviations above long-term means which were at 8% at that time. Of course, that preceded the May slide which knocked about 5% off of stock prices at the time.
Currently, prices are almost 10% above the long-term mean.
As I stated back in May, this doesn’t mean the market will begin a mean reversion process tomorrow; but, it is suggestive of a market that is certainly at risk of a reversal.
There is one thing the Fed can’t fix by lowering rates – corporate earnings. Next week, the markets will begin to face the quarterly barrage of reports. Don’t worry, as always, we will see a high percentage of companies “beating estimates.”
As I discussed previously, such shouldn’t be a surprise given the massive reduction in expectations leading up to reporting season.
This is why I call it “Millennial Soccer.”
Another warning sign for investors, and something they should be paying attention to, is the rather dramatic decline in net income from a year ago.
While it is currently expected the slowdown in earnings this quarter is a temporary anomaly, the reality is it may not be. The ongoing trade war with China, potential for additional tariffs, and slower economic growth suggest earnings weakness may be with us longer than many suspect.
The chart below shows the changes in estimates a bit more clearly.
It compares where estimates were on January 1st, 2018 versus April, May, and July of 2019. You can see the massive downward revisions to estimates over the last year.
As I stated above, this is why a high percentage of companies ALWAYS beat their estimates. Had analysts been required to stick with their original estimates, the beat rate would be close to zero.
Here is another way to look at it. In June of 2017, I wrote “The Drums Of Trade War” stating:
As of the end of the Q1-2019 reporting period, guess where we are? Exactly 11% lower than where we started which, as stated then, has effectively wiped out all the benefit from the tax cuts.
However, note that analysts are still widely optimistic of a sharp “hockey stick” rebound in earnings by year-end. These estimates, and the ones into 2020, still need to be revised sharply lower.
Since we are playing “Millennial Soccer,” let’s look at data which is devoid of much of the manipulation. Corporate profits, rather than earnings, is what is reported to the Internal Revenue Service for taxation purposes. It strips out the accounting gimmicks found in operating earnings, share buybacks, and other obscuring factors.
As noted previously, corporate profits have declined over the last two quarters and are at the same level as in 2014 with the stock market higher by almost 60%.
In other words, investors are paying a very high price for ownership currently. In fact, it is not just price-to-corporate profits which is elevated, but rather the majority of measures of valuation are at historic extremes. As noted by Zerohedge yesterday:
While valuations may not seem to matter at the moment, they eventually will. In fact, the lack of concern about valuations is simply another byproduct of extreme complacency.
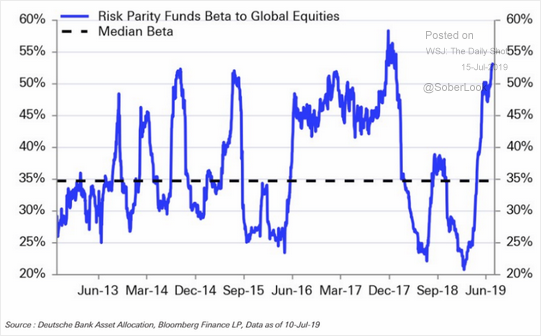
The current levels of complacency will end. It is only a function of when, not if. As noted by the WSJ on Monday, fund managers have been piling into beta as markets have risen to garner more exposure to“risk.”
The same is true for hedge funds which are also piling into equity risk in order to generate returns. (It is worth noting previous peaks in equity increases which has been a good contrarian indicator in the past.)
This rush back into equities should not be surprising.
The one thing about bullish sentiment is that it begets more bullish sentiment. The more the market rises, the more ingrained the belief comes that it can only go higher. In a “Pavlovian” manner, as each “dip” is bought, the “fear” of loss is eliminated repeatedly teaching investors they should “only buy” and “never sell.”
This is why, as I noted over the weekend, we remain bullishly biased in portfolios for now.
As noted above, while market participants are “giddy” about the prospects for the markets based on the Fed cutting rates, there is a laundry list of things issuing warning signals. We can add to the list above:
But, for now, this “wall of worry” has yielded little concern.
The more the market rises, the more reinforced the belief “this time is different” becomes.
That was on December 7, 2007.
Source: Zerohedge.com
Powered by NewsAPI.org
Keywords:
Market trend • S&P 500 Index • Market trend • Central bank • The Wall Street Journal • Interest rate • Volatility (finance) • S&P 500 Index • Volatility (finance) • S&P 500 Index • Volatility (finance) • Market trend • Stock • Financial market • Regression toward the mean • Corporation • Income • Market (economics) • Fiscal year • Millennium • Association football • Warning sign • Net income • Trade war • China • Tariff • Economic growth • Drum kit • Hockey stick • Association football • Corporation • Profit (accounting) • Income • Internal Revenue Service • Tax • Accounting • Earnings • Share (finance) • Corporation • Profit (accounting) • Fiscal year • Stock market • Investor • Fact • Just price • Zero Hedge • Fact • The Wall Street Journal • Investment management • Beta (finance) • Market (economics) • Hedge fund • Equity risk • Order (exchange) • Rate of return • Contrarian investing • Technical indicator • Stock • Market trend • Market trend • Classical conditioning • Fear • Investor • Trade • Media bias • Market (economics) •