Why The Fed Could Cut By 50bps And Why It Won't Matter - 8 minutes read
 Why The Fed Could Cut By 50bps And Why It Won't Matter
Last week, we laid out the bull and bear case for the market.
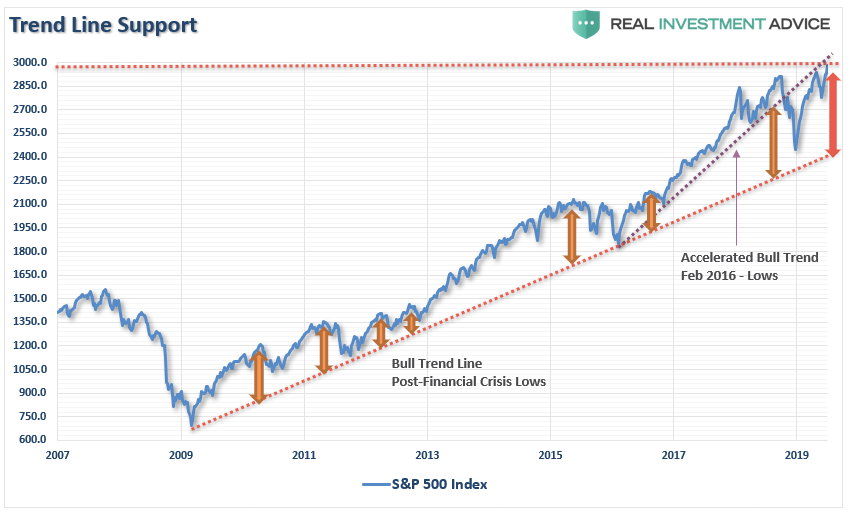
We laid out the case for a near-term mean reversion because of the massive extension above the long-term mean.
We added a 2x-short S&P 500 index fund to Equity Long-Short Account to hedge our longs against a potential mean reversion.
Last week, we laid out the bull and bear case for the market:
We laid out the case for a near-term mean reversion because of the massive extension above the long-term mean. To wit:
This analysis led us to take action for our RIAPRO subscribers last week, as we added a 2x-short S&P 500 index fund to Equity Long-Short Account to hedge our longs against a potential mean reversion. (On Friday that portfolio was UP .03% while the market FELL by 0.62%).
This is the purpose of hedging, as it reduces volatility over time, which inherently reduces the risk of emotionally based trading mistakes.
The correction this past week was not surprising as we wrote previously:
While the market is still hanging above the May highs, further corrective actions are likely next week as the short-term oversold conditions have not been resolved as of yet. The deviation above the long-term mean is also only starting to reverse as well.
Importantly, once we get past the end of the month, and assuming the Fed does indeed cut rates and no "trade deal" with China, the markets will return their focus to economics and earnings. As we stated previously:
More importantly, as Chris Kimble noted on Friday, the market is continuing to ignore the economic warnings being sent by bonds and commodities.
Moreover, the "Dumb Money" is now all the way back in.
These last two charts confirm the old Wall Street axiom:
This is why we are hedging our risk, carrying a higher level of cash, and holding onto our bonds as if they were the last lifeboat on the Titanic.
It is now widely expected the Fed will cut rates at the end of the month following comments by Fed officials last week. Per the WSJ:
Interestingly, that statement was quickly walked back by the NY Fed:
With the markets pushing record highs, recent employment and regional manufacturing surveys showing improvement, and retail sales rebounding, it certainly suggests the Fed should remain patient on hiking rates for now at least until more data becomes available. Patience would also seem logical given very limited room to lower rates before returning to the "zero bound."
However, there is also support for rate cuts. This is the point we will discuss today.
The Fed's own recession probabilities index has spiked to levels historically coincident with the onset of a recession. (Yes, this time could be different, but probably not a bet the Fed is willing to take).
Interest rates are a direct reflection of economic growth. As I wrote in December 2018 in "Why Gundlach Is Still Wrong About Higher Rates:"
Currently, 50% of the 10-yield curves we track are inverted and have remained so for more than three months. Historically, when inversions last for one-quarter or more in duration, recessions have not been too far behind.
However, one of the biggest reasons the Fed is about to cut rates by up to one-half point is to un-invert the Fed Funds to the 10-year Treasury rate. The inversion between the ultra-short and long-end of the curve is impairing loan activity. The Fed clearly understands that if it doesn't resolve this inversion, the probability of a recession grows rapidly.
There is also substantial "hard data" evidence the economy in under severe pressure. While "sentiment-based" surveys, or "soft data," have rebounded recently, data like the "Cass Freight Index" is ringing alarm bells.
However, it is the Leading Economic Indicator (LEI) index, which has our attention currently.
The consensus estimate was for LEI of +0.1, the read was a -0.3
This decline is not surprising to us. In July of 2018, as noted in the chart below, we laid out a predicted path of reversion in the LEI index. As you can see, the reversion has been even sharper than we originally estimated.
What is more concerning, and a reason the Fed is likely acting now, is there is a high correlation between the LEI and GDP, economic activity, and corporate profits. When compared to nominal GDP, the LEI index is suggesting a sharp slowdown is just ahead.
The Chicago Fed National Activity Index (CFNAI) is one of the broadest measures (80-sub components) of economic activity. The LEI and CFNAI, not surprisingly, also have a high correlation, which suggests further weakness is ahead.
Of course, if GDP, as well as underlying economic activity, is slowing down, it should not be surprising that corporate profits also decline.
The LEI is certainly not a perfect indicator for recessionary activity and has provided many false signals since the 2009 lows. However, the recessionary correlation is the highest when the LEI is signaling a recessionary warning at the same time the Fed Funds/10-Year yield inversion in place.
I think the Fed is beginning to panic as it was never able to get yields up to high enough levels to be effective in the next recession. Of course, this is exactly what we said would happen numerous times previously:
Janet Yellen was smart enough to "exit" and stick Jerome Powell with the "tab."
While the market rallied back from its 20% decline last year on "hopes" of an end to the "trade war" and "rate cuts," the market is missing an important part of the picture.
My friend Patrick Watson recently penned the problem for the Fed:
Also, "stimulus" works best when the "patient" is in the worse possible condition, not when the patient is healthy. As I wrote in "QE - Then, Now, & Why It May Not Work:
Let me be clear; it is certainly possible that asset prices could rise in the short-term given the "training"investors have received over the last decade to "Buy The F***ing Dip." However, given the economic and fundamental backdrop, rate cuts will not change the onset, duration, or intensity of the coming recession.
Yes, participate with the "rate cut rally."
We will be.
Just make sure you have a strategy to "leave the party before the cops arrive."
See you next week.
There are four steps to allocation changes based on 25% reduction increments. As noted in the chart above, a 100% allocation level is equal to 60% stocks. I never advocate being 100% out of the market as it is far too difficult to reverse course when the market changes from a negative to a positive trend. Emotions keep us from taking the correct action.
As noted last week, the market breakout was straining the deviation from the long-term moving average. Such a situation rarely last for very long.
That corrective process started at the end of last week despite Fed officials trying to assure the markets a rate cut is coming.
That remained the case this week. If you have not taken any actions in your plan, do the following on Monday.
With the markets back to extremely overbought conditions, patience will likely be rewarded.
Editor's Note: The summary bullets for this article were chosen by Seeking Alpha editors.
Source: Seekingalpha.com
Powered by NewsAPI.org
Keywords:
Mean reversion (finance) • Short (finance) • S&P 500 Index • Index fund • Mean reversion (finance) • Mean reversion (finance) • S&P 500 Index • Index fund • Mean reversion (finance) • Portfolio (finance) • Market (economics) • Volatility (finance) • Time • Risk • Financial market • Market trend • Financial market • Week • Term (time) • Term (time) • Month • China • Market (economics) • Economics • Income • Market (economics) • Economy • Bond (finance) • Commodity • Money • Wall Street • Axiom • Lifeboat (shipboard) • RMS Titanic • The Wall Street Journal • Employment • Manufacturing • Retail • Great Recession • Probability • Recession • Gambling • Federal Reserve System • Interest rate • Economic growth • Yield curve • Federal funds • Multiplicative inverse • Multiplicative inverse • Probability • Recession • Data • Survey methodology • Data • Data • Economic indicator • Consensus estimate • Reason • Correlation and dependence • Romanian leu • Economics • Corporation • Gross domestic product • Romanian leu • Federal Reserve Bank of Chicago • Economics • Romanian leu • Correlation and dependence • Gross domestic product • Economics • Correlation and dependence • Federal funds • Inversion (meteorology) • Great Recession • Janet Yellen • Market (economics) • Trade war • Market (economics) • Investment • Economy • Interest rate • Recession • Market (economics) • Market (economics) • Breakout (technical analysis) • Standard deviation • Moving average • This Week (ABC TV series) • Seeking Alpha •