July Business Conditions Monthly - 11 minutes read
 July Business Conditions Monthly
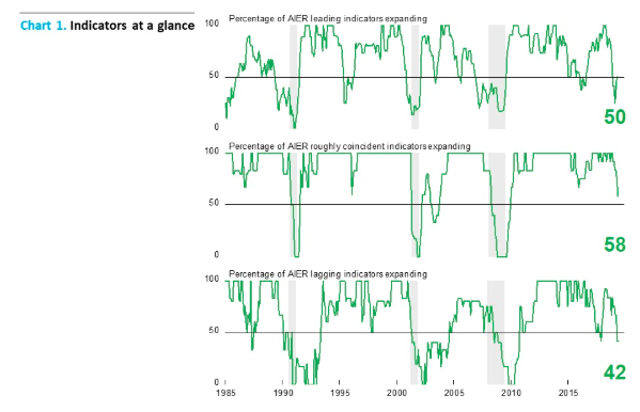
The AIER Leading Indicators index maintained a neutral 50 reading in June; high levels of uncertainty regarding trade and monetary policy are the major risks to the outlook.
AIER's Leading Indicators index was unchanged in June, holding at the neutral reading of 50. The Lagging Indicators index was also unchanged in the latest month, repeating the May result of 42. The Roughly Coincident Indicators index fell for a second straight month, to 58 (see chart). The back-to-back neutral 50 readings for the Leading Indicators index reflect the uneven performance of and high degree of uncertainty in the U.S. economy.
A strong rebound in job creation in June all but guarantees the current economic expansion ties the record for duration. Continued economic growth in July means the current expansion will set a new record of 121 consecutive months of growth.
Despite the achievement, the outlook remains highly uncertain. Erratic trade policy, tariffs, escalating trade wars, deteriorating relations with major trading partners, and slowing global growth represent threats to continued economic expansion. Questions about the direction of monetary policy and policy makers' decision-making process further complicate the outlook. Erratic leadership and unclear policy remain significant risks.
Though the Leading Indicators index was unchanged for the month, four indicators within the index changed direction. Among the 12 leading indicators, 5 are trending higher, 2 are neutral, and 5 are trending lower versus 4 trending higher, 4 neutral, and 4 trending lower in May. Among the four indicators that changed, initial claims weakened to a neutral trend from a positive trend. As discussed in prior months, initial claims is one of the indicators with boundaries. It can go no lower than zero, and in practical terms, it is unlikely to go much lower than the roughly 200,000 level it is currently at. It's not surprising that this indicator would eventually turn to a neutral or flat trend. Though moving to neutral does lower the score of the Leading Indicators index, it's not a very bad sign.
The real retail-sales indicator improved in the latest month, moving from a flat trend to a positive trend. While it's a good sign for the economy, the improvement was offset by a deterioration in real new orders for consumer goods, which weakened from a flat trend to a downtrend. Data related to the consumer are of particular importance to the outlook given that consumer spending accounts for about 70 percent of gross domestic product.
Heavy-truck unit sales is the fourth indicator to change direction in June, improving from a neutral trend to a positive trend. This indicator is related to business investment and may signify an improving level of confidence in the economic outlook by businesses.
The Roughly Coincident Indicators index fell 17 points to 58 in June from 75 in May. The employment-population ratio and consumer confidence in the present situation both declined, to a neutral trend and downtrend, respectively. On balance, three roughly coincident indicators remained in uptrends (nonfarm payrolls, real manufacturing and trade sales, and real personal income excluding transfers) while two were in downtrends (industrial production and consumer confidence in the present situation) and one was neutral (employment-population ratio).
The Lagging Indicators index held at a reading of 42 in June. Among the six lagging indicators, just two were trending higher while three were trending lower and one was neutral. No indicators changed direction in the latest update.
Overall, the back-to-back neutral 50 readings for the Leading Indicators index reduce some of the cause for concern arising from its weak performance during the first four months of 2019. However, continued mixed results from economic reports, a high degree of uncertainty regarding trade and monetary policy, the impact of rising tariffs, and signs of slowing global growth are clouding the outlook for the economy and suggest a high degree of caution remains warranted.
The University of Michigan Surveys of Consumers show overall consumer sentiment fell slightly in June. Consumer sentiment decreased to 98.2, down from 100.0 in May, a 1.8 percent decline. From a year ago, the index is unchanged. Despite the slight decline for the month, sentiment is holding at very favorable levels.
The two sub-indexes had opposing performances in June. First, the current economic conditions index rose to 111.9 from 110.0 in May, a 1.7 percent gain for the month but a 3.9 percent decrease from June 2018. Consumer expectations, one of the AIER leading indicators - fell 4.5 percent for the month but still showed a 3.5 percent gain from the prior year. The index came in at 89.3 in June versus 93.5 in May.
According to the report,
The small business optimism index from the National Federation of Independent Business rose to 105.0 in May, up 1.5 points from 103.5 in April and 3.8 points below the all-time high of 108.8 in August 2018. The latest result extends a run of 30 consecutive months above 100, a very high figure by historical comparison. The strong result was buoyed by positive results for capital spending, hiring, inventory investment, and profit trends.
The general outlook remained positive as the percentage of respondents believing now is a good time to expand came in at 30, up from 25 in April. The net percentage of respondents expecting better economic conditions ("better" minus "worse") came in at 16, up from 13 in April but still high compared to negative numbers in 2016 when the economy slowed sharply. A net 23 percent expect higher sales over the coming months while a net 9 percent report higher sales for the most recent three months versus the prior three months.
Capital expenditures by small businesses also remain solid, with 64 percent of such businesses having made capital expenditures during the past six months. Thirty percent of firms have plans for capital expenditures over the next three to six months, up from 27 percent in the prior month.
The percentage of firms planning to increase employment rose to 21 percent from 20 percent in April. A near-record 38 percent (versus a record 39 percent) of firms report having openings they are not able to fill. Meanwhile, the percentage of firms reporting few or no qualified applicants for job openings was 54 percent, up from 49 percent in April and just 1 point below the record 55 percent from June 2018. That combination in the labor market of healthy demand and weak supply has a net 34 percent of firms saying they have already increased compensation over the past three months while a net 24 percent intend to increase worker pay over the coming months.
The labor-market dynamics have made quality of labor the most important issue for small businesses. Among the 10 issues listed in the survey, quality of labor ranks first at 25 percent, tying the survey high. Taxes were second at 16 percent while government regulation and red tape was third on the list at 12 percent.
The labor market rebounded in June. Nonfarm payrolls added 224,000 jobs in June after an increase of just 72,000 new jobs in May. For the private sector, nonfarm payrolls added 191,000 in June following a gain of 83,000 in May. On a three-month-average basis, private payrolls added 156,000. Over the past year, the average gain is 192,000 for total nonfarm jobs and 183,000 for the private sector.
Average hourly earnings rose 0.2 percent in June, leaving the 12-month change at 3.1 percent, down from a peak of 3.4 percent in February but above 3 percent for the ninth consecutive month. Average hourly earnings growth has been slow compared to previous cycles, especially given the low unemployment rate.
Average weekly hours were unchanged at 34.4. Combining payrolls with hourly earnings and hours worked, the index of aggregate weekly payrolls rose 0.4 percent in June and 4.7 percent from a year ago. This index is a good proxy for take-home pay and has posted relatively steady year-over-year gains in the 4 to 6 percent range since 2010. Continued gain in the aggregate-payrolls index is a positive sign for consumer income and spending, which supports continued economic expansion.
Retail sales and food services rose 0.5 percent in May, following an upwardly revised 0.3 percent gain in April. The May increase was the third rise in a row and fourth in the last five months. Over the past year, they are up 3.2 percent. Retail sales excluding gasoline rose 0.6 percent in May following a 0.1 percent gain in April. From a year ago, retail sales excluding gas are also up 3.2 percent. Retail sales growth has been in the 2 to 6 percent range since 2010, putting the current pace toward the lower end of the range.
Gains in retail sales in May were widespread among the components. Non-store retailers increased 1.4 percent for the month, the best of the monthly gainers, and led all categories with an 11.4 percent rise over the past year. Other strong performers in May include electronics and appliance stores and sporting-goods, hobby, musical-instruments, and book stores, gaining 1.1 percent for the month, restaurants, up 0.7 percent, and health and personal-care stores, up 0.6 percent. The only major components to show a decline for the month were food and beverage stores, for which sales fell 0.1 percent for the month but which still show a 1.6 percent increase over the past year, and miscellaneous store retailers, whose sales dropped by 1.3 percent and are down 2.6 percent from a year ago.
Unit sales of light vehicles totaled 17.3 million at an annual rate in June, down from a 17.4 million pace in May. The pace of sales in June remains above the midpoint of the 16- to 18-million-unit range we have seen for much of the past two decades.
Business investment (capital-goods expenditures) can have a major impact on future productivity trends, and productivity is critical for helping offset cost increases and raising living standards over the long term. Furthermore, capital-goods orders tend to be early indicators of turns in the business cycle. Real new orders for core capital goods - that is, real non-defense capital goods excluding aircraft - is one of the indicators in AIER's Leading Indicators index. On a nominal basis, new orders for core capital goods rose 0.5 percent in May. Year to date, core-capital-goods orders are up 2.3 percent to $341.8 billion versus $334.3 billion for the first five months of 2018.
Editor's Note: The summary bullets for this article were chosen by Seeking Alpha editors.
Source: Seekingalpha.com
Powered by NewsAPI.org
Keywords:
Business • American Institute for Economic Research • Economic indicator • Uncertainty • Trade • Monetary policy • Risk • American Institute for Economic Research • Economic indicator • Economic indicator • Economic indicator • Uncertainty • Economy of the United States • Unemployment • Economic growth • Uncertainty • Commercial policy • Tariff • Trade war • International relations • International trade • Globalization • Economic growth • Management • Monetary policy • Policy • Decision-making • Leadership • Risk • Economic indicator • Economic indicator • Positivism • Pragmatism • Economic indicator • Real versus nominal value (economics) • Economics • Consumer spending • Financial statement • Gross domestic product • Sales • Economic indicator • Management • Economic indicator • Business • Investment • Economic indicator • Index (economics) • Ratio • Consumer confidence • Economic indicator • Nonfarm payrolls • Manufacturing • Trade • Industry • Consumer confidence • Employment • Economic indicator • Economic indicator • Economic indicator • Economy • Uncertainty • Trade • Monetary policy • Tariff • Globalization • Economic growth • Economy • University of Michigan • Economics • Percentage • Percentage • Expected value • American Institute for Economic Research • Economic indicator • Percentage • National Federation of Independent Business • Inventory investment • Percentage • Economy • Percentage • Sales • Sales • Percentage • Percentage • Percentage • Percentage • Percentage • Percentage • Percentage • Job • Labour economics • Supply and demand • Internet • Legal personality • Wage • Workforce • Labour economics • Quality control • Survey methodology • Quality control • Labour economics • Tax • Regulation • Red tape • Labour economics • Nonfarm payrolls • Employment • Nonfarm payrolls • Unemployment • Working time • Income • Working time • Aggregate demand • Aggregate demand • Consumer • Gasoline • Percentage • Percentage • Retail • Electronics • Sports equipment • Hobby • Book • Retail • Health • Personal care • Retail • Retail • Sales • Retail • Retail • Sales • Percentage • Percentage • Units of measurement • Rate (mathematics) • Decade • Business • Investment • Capital (economics) • Cost • Future • Productivity • Productivity • Critical theory • Cost • Standard of living • Capital (economics) • Economic indicator • Business cycle • Tier 1 capital • Capital (economics) • Capital (economics) • American Institute for Economic Research • Economic indicator • Gross domestic product • Capital (economics) • Seeking Alpha •