Visualizing City Cores with H3, Uber’s Open Source Geospatial Indexing System - 2 minutes read
 Visualizing City Cores with H3, Uber’s Open Source Geospatial Indexing System
At Uber, we leverage large geospatial datasets to power ourmarketplace algorithms, leading to more accurate ETAs, dynamic pricing, and better routes for users on our platform.
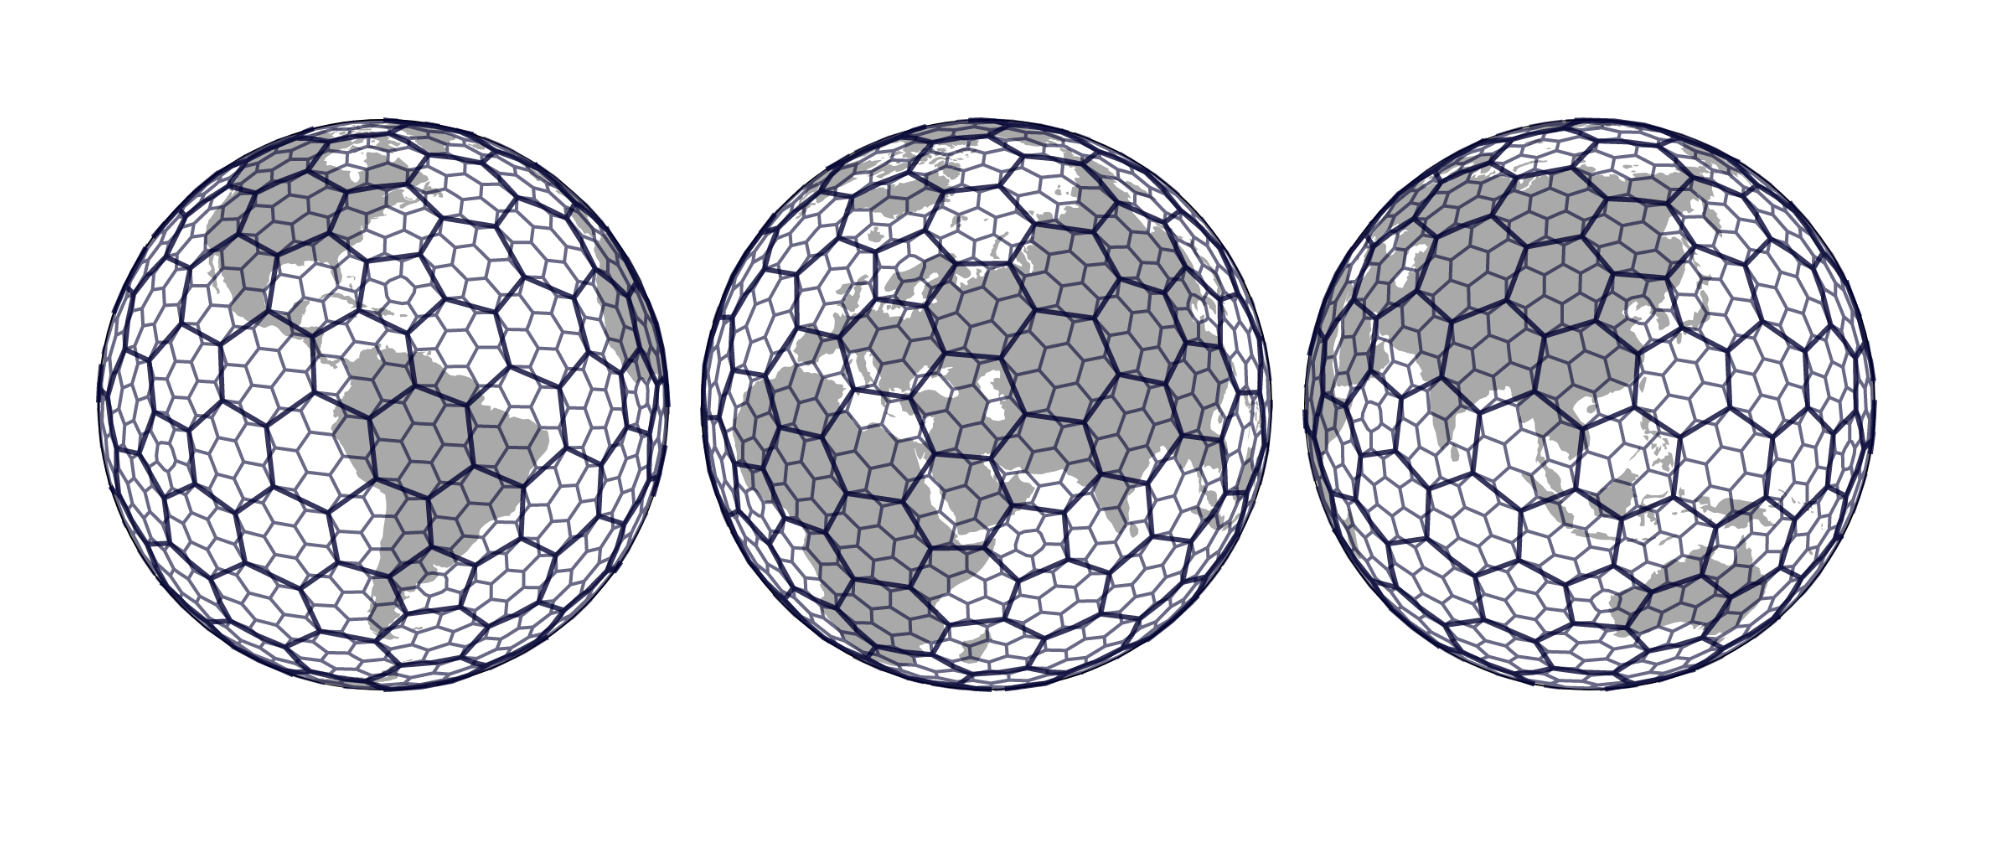
Deriving information and insights from data in the Uber marketplace requires analyzing data across an entire city. Grid systems, which partition geographic areas into identifiable cells and facilitate the exploration of data at a fine granularity, are critical to this effort. When Uber designeda grid system to bucket geospatial events, we looked to the hexagon, a shape that enabled us to minimize quantization error and easily approximate radiuses.
In 2018, Uber open sourcedH3, our hexagonal grid system for visualizing geospatial data, enabling the broad adoption of this powerful and easy-to-use software. In the videos below, members of our engineering and data science teams discuss how to most effectively use H3 for geospatial indexing:
Grid systems enable data analysis to abstract the messiness away from large-scale data sets for easy mathematical computations. In this presentation, Nick Rabinowitz discusses common grid operations and outlines how H3 leverages hexagons to easily aggregate and explore geospatial data from the Uber platform.
Uber leverages clusters of hexagonal cells to engineer our H3-based geospatial platform. Ankit Mehta explains why we chose hexagonal clusters over other cluster shapes and highlights how our Marketplace Intelligence team is building an efficient and scalable H3-based geospatial data platform to facilitate improved user experiences.
Previously manually drawn, city cores are the geospatial areas where our ridesharing business is densest. This manual process of defining city cores was time-intensive and required local knowledge about the city. Marie-Camille Achard and Camilla Nawaz discuss how H3 enables us to easily understand at scale where city cores are located.
Interested in learning more about H3? Check out theproject’s official pageand try it out for yourself!
If building visualization tools to explore large-scale geospatial data sets interests you, consider applying for a role on our team!
Source: Uber.com
Powered by NewsAPI.org
Keywords:
Visualization (graphics) • Hydrogen • Open-source model • System • Mechanical advantage • Algorithm • Accuracy and precision • Dynamic pricing • Information • Data • Data • Quantization (signal processing) • Geographic information system • Software • Engineering • Data science • Data analysis • Mathematics • Hydrogen • Hexagon • Geographic information system • Hexagon • Geographic information system • Carpool • Hydrogen • Hydrogen • Construction • Visualization (graphics) • Tool • Geographic information system •